Economic Impact of U.S. Indigenous Tourism Businesses
The Economic Impact of U.S. Indigenous Tourism Businesses Report describes the American Indian, Alaska Native and Native Hawaiians (AIANNH) owned businesses in the United States’ tourism and hospitality sector.
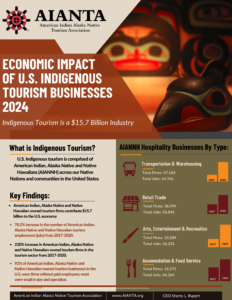
Key Findings
- AIANNH hospitality businesses contribute $14 billion in annual sales.
- One in four (26%) of all AIANNH businesses are in the hospitality industry.
- There are 40,618 AIANNH hospitality businesses in the U.S.
- There are 154,350 total AIANNH businesses (across all sectors, including hospitality) in the U.S. and they account for one half of one percent of all total U.S. businesses
- 79% of AIANNH hospitality businesses are self-employed professionals.
Economic Impact of Indigenous Tourism Businesses (Fall 2021)
In 2017, there were 40,618 firms owned by American Indian, Alaska Native, and Native Hawaiians (AIANNH) entrepreneurs in the U.S. tourism sector. This accounts for 26% of all 154,350 AIANNH-owned businesses.
Growth
Between 2012 and 2017, the average annual sales for AIANNH hospitality businesses grew at nearly triple the rate of that of all AIANNH businesses.
AIANNH Hospitality Businesses
- Annual sales (2017): $14 billion
- Annual sales (2012): $11.7 billion
- 19.1% growth
All AIANNH Businesses
- Annual sales (2017): $50.4 billion
- Annual sales (2012): $47 billion
- 7.3% growth
AIANNH Businesses (Hospitality vs. All)
Hospitality businesses owned by the AIANNH community significantly outperform all AIANNH businesses.
- Annual Sales (average): $1.91 million (hospitality) vs $1.48 million (all)
- Number of Employees (average): 11.6 (hospitality) vs. 8.8 (all)
Hospitality Businesses (AIANNH vs. All)
AIANNH hospitality businesses underperform against all hospitality businesses. .
- Average number of employees: 2.1 (AIANNH) vs 5.0 (all)
- Average wage per employee: $26,100 (AIANNH) vs $27,600 (all)
- Average sales per company ($1,000): $343.8 (AIANNH) vs. $958.4 (all)
AIANNH Businesses by Type
Total Firms (AIANNH Businesses)
- Transportation & Warehousing, 15,771 (39%)
- Accommodation and Food Services, 12,853 (32%)
- Arts, Entertainment and Recreation, 7,104 (17%)
- Retail Trade, 4,890 (12%)
Annual Sales (AIANNH Businesses)
- Retail Trade, $7.79 billion (56%)
- Transportation & Warehousing, $2.73 billion (19%)
- Accommodation and Food Services, $2.51 billion (18%)
- Arts, Entertainment and Recreation, $.94 billion (7%)
Number of Jobs (AIANNH Businesses)
- Accommodation and Food Services, 45,756 (39%)
- Retail Trade, 34,689 (29%)
- Transportation & Warehousing, 26,240 (22%)
- Arts, Entertainment and Recreation, 11,167 (10%)
Firms with Employees vs. Self-Employed Professionals
More than 8 in ten AIANNH hospitality businesses are self-employed professionals.
- Firms w/ paid employees, 7,328 (18%)
- Self-employed, 33,300 (82%)
Firms w/ Paid Employees
- Retail Trade (43%)
- Accommodation and Food Services (32%)
- Transportation & Warehousing (16%)
- Arts, Entertainment and Recreation (8%)
Self-Employed Professionals
- Transportation & Warehousing (44%)
- Retail Trade (29%)
- Arts, Entertainment and Recreation (20%)
- Accommodation and Food Services (8%)
About the Economic Impact of Indigenous Tourism Businesses Report
This report describes American Indian, Alaska Native, and Native Hawaiian (AIANNH) owned businesses in the U.S.
tourism and hospitality sector, including
(1) accommodations & food services;
(2) arts, entertainment & recreation;
(3) retail trade; and
(4) transportation & warehousing.
The data used in this analysis were obtained from the U.S. Census, Annual Business Survey 2017 (ABS) and U.S. Census Non-Employer Statistics by Demographics 2017 (NESD). The ABS contained information on business ownership, while the NESD data contain non-employer’s statistics by demographics in the U.S.
American Indian Alaska Native Tourism Association, Inc.
www.aianta.org
Prepared by
SMS Research
www.smshawaii.com